Multitasking is hard; but managing complex projects or running your business usually has numerous aspects that all demand your attention. Wouldn’t it be great if you could aggregate all these information into one view so you can stay on top with ease?
This article shows you how to create your own custom dashboards for your projects or your business.
Don’t have Pagico 9.7 yet? Download here.
Step 1: Categorize Your Content
First off, you need to properly identify your content. A complex project, such as a business, may involve all types of data spanning across a number of Pagico projects and even contacts. So it’s best to create some categories and assign those categories accordingly.
To create categories, go to the Preferences -> Database-specific section.
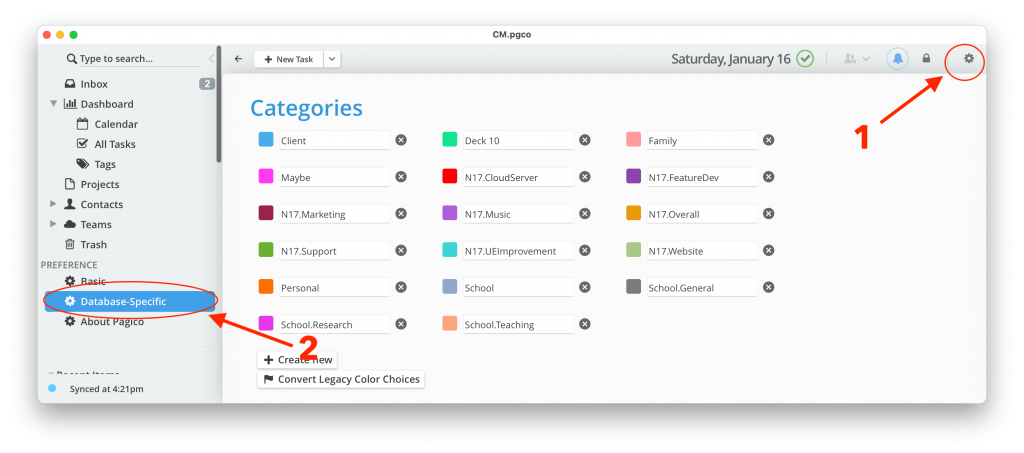
Every business involves numerous aspects. So it’s recommended to designate multiple categories to better target these different aspects. For instance, at N17, we have a category called “N17.Marketing” for everything marketing-related; “N17.FeatureDev” for feature development, and “N17.Overall” as a catch-all category for everything else, etc.
The best part about using categories? You can also set custom colors for each category. That way your content will be rendered in a visually different way, making things easier to find.
To assign categories to your data, whether it’s a project, a list, a task, a file or really just about anything in Pagico: just right-click and select the desired category. To mass categorize lots of things, just select the desired items, then right-click and categorize.
Categories and Tags
Categories are perfect for larger, more permanent classifications of data. For instance, if you run multiple businesses, consider having a few categories for each business. If you play multiple roles across your projects, consider using categories for your different roles. The general rule is that you don’t want to have too many categories; otherwise they become clunky to use and you’ll have things color-coded in similar colors.
For a more flexible way of defining things, consider using tags. For instance, you can label out key types of actions using tags. Writing tags in Pagico is easy — just use the @keyword syntax anywhere you need, like this:
There are many ways to use tags. For instance, you can use tags to identify the type of action needed (@call, @email, @visit, etc), task status (@stalled, @waiting), personnel (@tom, @ann), or importance level (@important, @optional). Tags will be rendered as tokens so they are visually outstanding from the rest of your content.
Step 2: Create a Dashboard
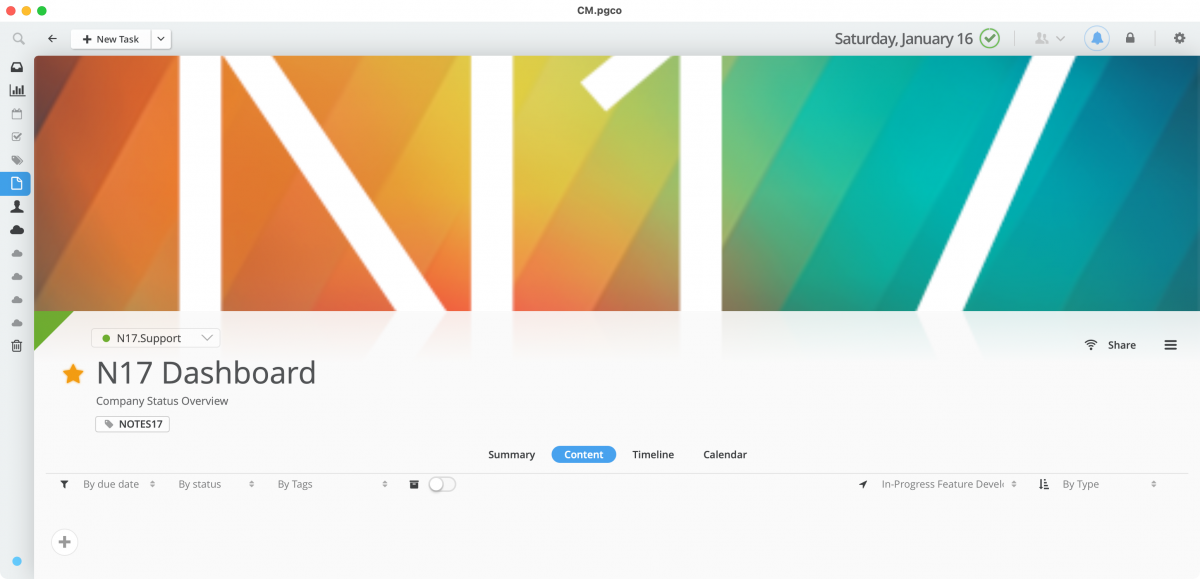
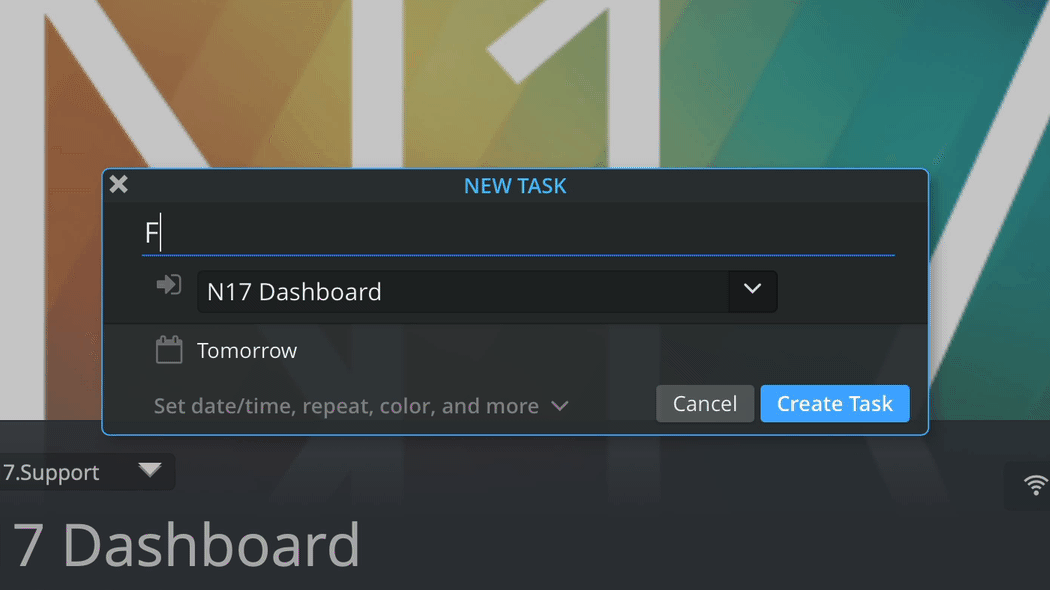
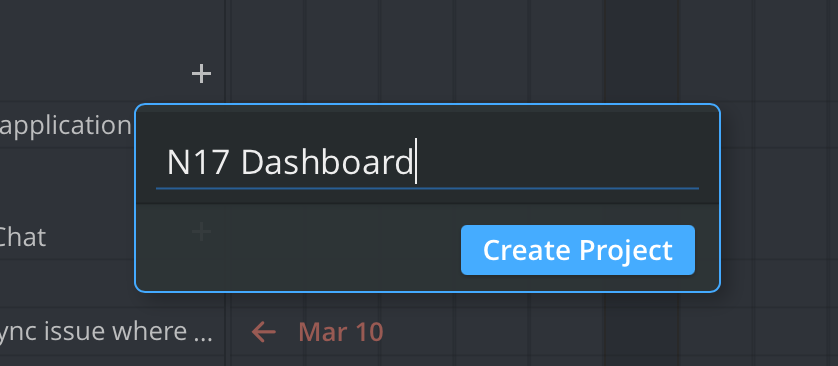
While Pagico already offers a Dashboard, that view shows you everything across your database. To create a dashboard just for your business or for one of your complex projects, you’ll need to create a new one. To do so, you’ll need to create a new Pagico Project. Press keyboard shortcut Cmd + N to bring up the New Project dialog, then type in a name. For example: N17 Dashboard.
Once you’re in your new project, make it feel like home by doing some of the following things:
- Set a project description. This could be your business slogan, or the current status of the business, etc.
- Tag it properly. Consider tagging the project with a “dashboard” keyword”. This way you can easily browse all your dashboards down the line. Also, tag it with a “business” keyword so you can locate this project from that perspective too.
- Consider setting a title image. Use a proper branding banner image to really set this project apart from your regular projects; it will make a huge difference!
Step 3: Customize the Content
You will create a few Smart Lists to aggregate the information you need to see on a regular basis. So ask yourself: What would you like to see periodically? Some common elements include key documents, recently completed tasks, pending tasks, overdue deadlines, and perhaps meeting notes, etc.
Let’s say you need a files section that lists all the financial documents pertaining to your business. So you’ll be creating a Smart List object with the following criteria:
- Type must be File
- Category must be N17.Finance
With that game plan in mind, let’s get started on the Smart List creation. First click on the “+” button near the top of your project, then choose “Smart List”. Click to define the criteria as shown in this video:
With this smart list, any document categorized as N17.Finance will be included in this list. The best part is: if I (or anyone on our team) updates or added a new financial document, I’ll get to see it here as well.
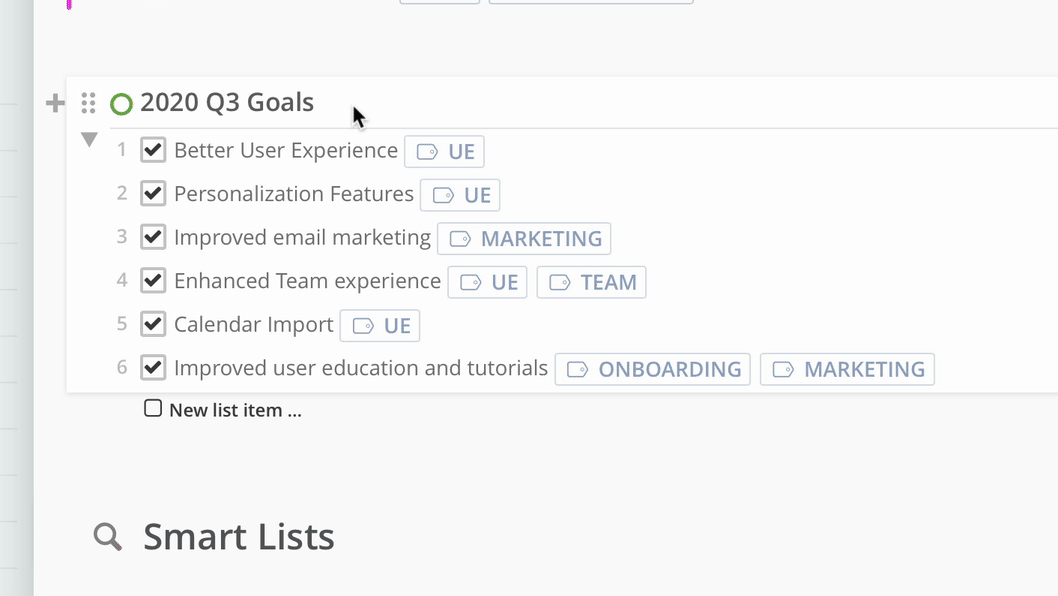
Following the same logic, you can create a list that shows all the pending tasks of a certain category. Here’s my criteria for showing pending software development tasks:
- Type set to List Item / Task
- Is Completed set to No
- Category set to N17.SoftwareDev
Want to only see things within the near future? Consider adding this extra criteria item:
- Task due set to “is on or before” with a value of “+15 days”.
With this extra criteria item, this smart list will only show things with a due date within the next 15 days. That way you won’t end up with a super long list that wound up not being helpful.
Want to learn more about using smart lists? Watch this video tutorial.
Step 4: Final Touchup’s
Normally speaking, your dashboard is complete with all the smart lists that you need. So here are some parting thoughts:
- Revise your dashboard as you come up with new ideas or new things to track.
- Suppose you have a few smart lists that track tasks. Switch to the Timeline and Calendar views of this Dashboard project, and you’ll see all these things neatly mapped out on those views. Perfect for planning and visualizing your workload.
- You can create a note and put it near the top. This note can behave like a message board; put in relevant notes or thoughts into it as a temporary brain offload area.
- Create container links to those highly relevant projects for easy access. For instance, the first thing I do in the morning is visiting my N17 Dashboard. Then I can easily switch to our latest software development project with a single click.
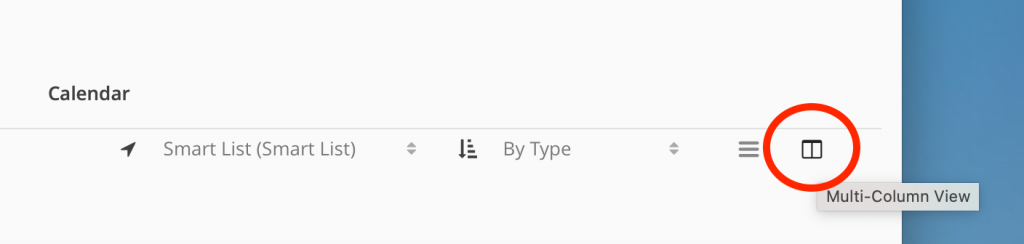
- If you have a big enough monitor, then consider enabling the multi-column mode to see more content in one view. Please note that the multi-column mode button may not be enabled if your Pagico window isn’t wide enough.
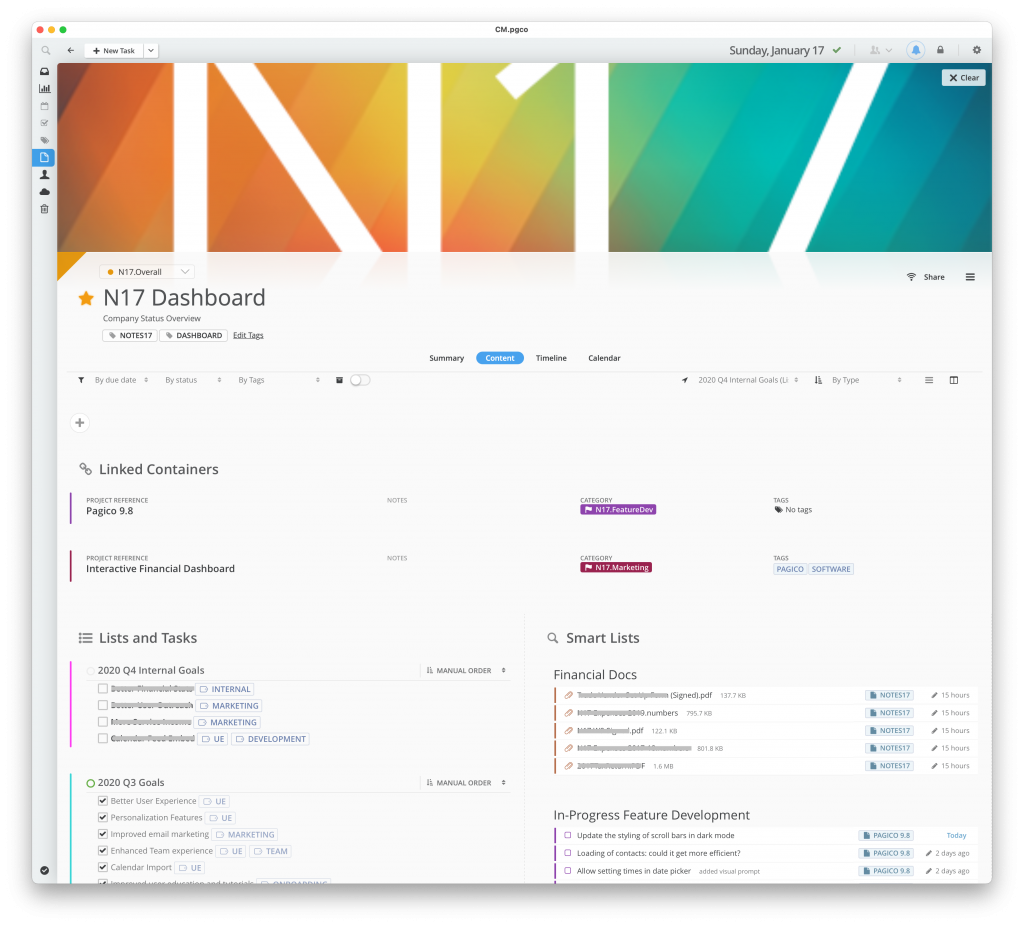
Here is what I have, in case you’re curious about the end result: